Mingo Logo Formerly SensrTrx
Overall Equipment Effectiveness

Calculate OEE

It only takes 30 seconds to get your results with our OEE Calculator.


(minutes per part)

OEE

{{oee*100 | number:0}}%

Capacity

{{capacity | number:0}}

Total Produced

{{totalQty | number:0}}

Performance

{{performance*100 | number:0}}%

Quality

{{quality*100 | number:0}}%

Availability

{{availability*100 | number:0}}%

Let's look at how we calculated your OEE above. The OEE formulas is:
Availability * Performance * Quality = OEE%
Let's break down each component of the OEE formula:

Availability

To calculate availability, we first need to determine the duration of the shift in minutes.
{{shiftStartFormatted}} - {{shiftEndFormatted}} = {{shiftLength}} minutes.
Then subtract breaks, lunches, and planned maintenance included in planned downtime.

Planned Production Time Formula:

Shift Length - Planned Downtime = Planned Production Time

Planned Production Time Calculation

{{shiftLength}} - {{plannedDowntime}} = {{plannedProductionTime}}
Next, calculate the operating time of the equipment. To do this, subtract any unplanned downtime from the planned production time.

Operating Time Formula:

Planned Production Time - Unplanned Downtime = Operating Time

Operating Time Calculation:

{{plannedProductionTime}} - {{unplannedDowntime}} = {{operatingTime}}
Now we can calculate the availability percentage.

Availability Formula:

Operating Time / Planned Production Time = Availability %

Availability Calculation:

{{operatingTime}} / {{plannedProductionTime}} = {{availability*100|number:2}}%

Performance

Performance is how the equipment is performing against its capacity. In this calculation, we use the ideal cycle time and operating time to determine how many parts the machine can produce under ideal operating conditions. We then calculate the ratio of how many parts we actually produced versus the capacity.

Capacity Formula:

(1/Ideal Cycle Time) * Operating Time = Capacity

Capacity Calculation:

(1/{{idealCycleTime}}) * {{operatingTime}} = {{capacity|number:2}}
To calculate performance, we use the total parts produced, this includes any scrap or rejected parts.

Performance Formula:

Total Parts Produced / Capacity = Performance %

Performance Calculation:

{{totalQty}} / {{capacity|number:2}} = {{performance*100|number:2}}%

Quality

Quality is the ration of good parts versus total production.

Quality Formula:

(Total Parts Produced - Total Scrap) / Total Parts Produced = Quality %

Quality Calculation:

({{totalQty}} - {{totalScrap}}) / {{totalQty}} = {{quality*100|number:2}}%

OEE Putting it Together

Now, we take each of the three components and put them in the the formula above.

OEE Formula:

Availability * Performance * Quality = OEE %

OEE Calculation:

{{availability|number:2}} * {{performance|number:2}} * {{quality|number:2}} = {{oee*100|number:2}}%
Go In-Depth

Still Have Questions About Calculating OEE?

We talk about OEE frequently in the manufacturing world; why it’s important, how to measure OEE, and why it is considered by some to be a magic number. But, to a certain extent, we need to pump the brakes on this question of measuring OEE. Why?

A large number of manufacturers we talk to are concerned only about their OEE number and not if it is being collected in an accurate or consistent way that can truly be tracked over time. Don’t get us wrong, they are carefully thinking about OEE, but they are more concerned with reaching a certain benchmark than they are about measuring it in a way that will allow them to see incremental progress over time. Which, is what we would argue is by far the most important thing to consider. Let us explain how you should think about and measure OEE.

Let’s say your OEE is theoretically very high, but month to month, it averages out to little to no real change. The most important thing to observe with shop floor operations is data consistency and improvement. You want to identify outliers that are causing wild swings in OEE one way or the other.

Monitoring OEE numbers, but not overall percentage changes can hide these important observations. They also open the door to subjective interpretations of OEE versus objective data-driven changes.

Let’s pretend that most manufacturers think they need to be at a certain OEE %. Maybe they think they should be at 80%(but, world-class OEE is a myth, more on that here). Staff and stakeholders will often manipulate the calculations to arrive at those target numbers by arguing over what should be counted as downtime. It does not give a true picture of how efficient the shop floor really is. It only gives a picture of how the data is calculated, collected, and skewed.

Should you include lunches and smoke breaks? Should you classify a lack of orders or a lack of raw material as planned downtime? These things affect those numbers. If your goal is to get to 80%, these things can be included, or not, to arrive at the target. If you focus on percentage improvements, you will be able to measure true improvements versus goal setting achievements.

The key to doing this is by collecting consistent data and looking at percentage changes. What the actual OEE number is absolutely does not matter.

Many organizational staff members will get into fights about how to classify this stuff and it skews the real results. It actually doesn’t matter what the OEE number is, or what you choose to collect and include and what you don’t. What fundamentally matters the most is the percentage changes over time.

What has to be done to achieve this is to collect the data the same way and ensure you have the same measurements in place over the long term.

Few organizations can actually do this today. This requires the ability to look at things in real-time and to see what actually occurs on the shop floor (not someone’s subjective data). But, manufacturing productivity and analytics software can do this.

But, let’s say you’re still focusing on OEE, and you find it is increasing. One of the most important parts about understanding what to do once you’ve increased OEE is establishing – in a credible fashion – that you actually have increased it. Duh, right? Not so fast. There are a lot of manufacturers out there that think they are reliably collecting machine data, but the data is neither accurate nor consistent.

Step 1 in determining if you are working from a consistent number should start by asking yourself, “How do I know for sure my data is right?” If you aren’t confident in your answer, consider what could be done about it. Tools like Mingo make it very easy to view all of your machine data.

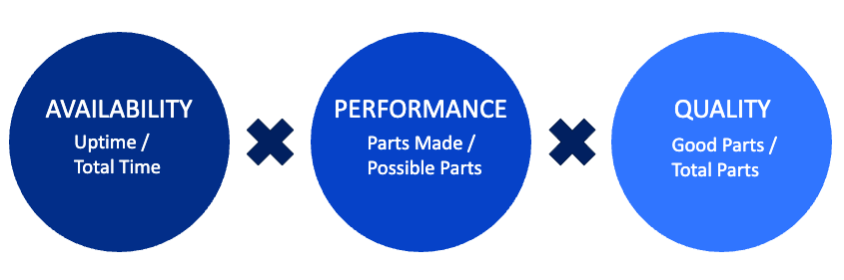
Once you can confirm the reliability of the data, you can identify key metrics that you can benchmark and measure against. This is the whole point of OEE. It’s the ability to establish an efficiency metric and see if the initiatives you put in place or improvements you make in processes can improve those things (but, OEE can be flawed, so be careful). If your data is good, you can usually identify issues and do something to improve them.

So, you’ve done it. You’ve collected accurate data, identified inefficiencies, made improvements, and measurably increased OEE. What else is there to do?

Look closely at is exactly why you were able to increase OEE. If you fully understand the mechanisms behind the increase you can determine if improvements are permanent, seasonal, or part of a larger, more complex process, etc. Knowing this information could help you make improvements in other parts of your business.

Fully understanding why your OEE goes up can be just as important as understanding why it goes down. Both impact all parts of your business and planning, and if systems of record don’t reflect performance, accuracy, and quality improvements you may never truly reap the benefits of marked improvements.

This means you need analytics that you can count on. This is where most manufacturers should start, not with an OEE number that provides almost no real context.

Looking for More Resources?

White Paper: Manufacturing Analytics

Find out why manufacturing analytics is important to improving your machine’s performance and OEE.

Guide: How to Implement IIoT in the Plant

Read this guide and learn how to implement IIoT and solve business challenges.

Blog: How to Calculate ROI

Calculate your return on investment with manufacturing productivity software.

Video: 4-Minute Demo on Reducing Downtime

Learn how to assess problems with downtime and availability of machines, and what to do about it.