
- OEE is a vital metric to most manufacturers, but it is even more beneficial when you view OEE as a financial KPI.
- When converted to a dollar amount, OEE is more widely understood by everyone in the factory.
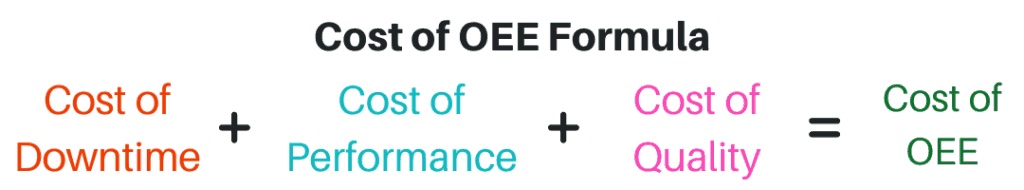
- Learn how to calculate the cost of OEE using downtime, performance, and quality. (See below for formulas.)
- The cost of OEE helps identify the financial impact of running faster, reducing downtime, and reducing scrap.
The Cost of OEE: Without Context, A Number is Meaningless
We talk a lot about OEE at Mingo. (See this OEE flawed metric blog and these experts agree OEE is a flawed blog) It’s not that we dislike OEE as a metric, quite the contrary actually. OEE is vital to the world of manufacturing, but let’s not forget that in order for that number to be effective, context is key. Our blog posts and rants on the topic are more in line with the need for context when using OEE because it seems to be, at some times, forgotten. Without context, any number, including OEE, doesn’t mean much.
A percentage is basically meaningless. To understand if 80% or 90% is good or not, you have to understand the numbers that form the percentage. Are those numbers good? (Again, we’re referring back to context, here.)
OEE follows the same concept. If you don’t understand quality, availability, or performance first, OEE is otherwise a flawed metric that can give skewed results. If the underlying metrics are understood, then, those and OEE can provide an immense amount of value to a manufacturer. When OEE is converted to a financial KPI, it provides even more.
OEE as a Financial KPI
OEE is most often shown in percentages, and typically, by the “world-class” metric of 85%. But, if OEE is displayed in dollars, it’s much more widely understood by everyone – operators to executives. Understanding dollar amounts, and subsequently the cost of OEE, is a universal concept.
For example, let’s say for a particular day, the production line is reporting 98% quality. Most people would think that is a great result and move on – operators, executives, everyone. But, if each part is worth $6,000 and out of 100 parts, 2 were scrapped, the manufacturer lost $12,000. That number doesn’t sound as good when shown in a dollar amount, right?
The manufacturer is looking at 98% and thinking it’s a good result, but in the end, they still lost $12,000.
$12,000 is a big oops, and one that needs to be fixed sooner rather than later because if 2 parts are scrapped every day for the next year, the manufacturer is looking at a very costly problem.
Seeing that number in a dollar amount versus a percentage offers a different perspective.
OEE Can Provide Other Financial Benefits, Too
The different perspective also enables manufacturers to use data collected from the floor as way to incentivize employees. If you’re able to convert OEE to a financial metric, you are able to translate results on the floor into monetary bonuses for operators.
If the numbers on the line look good and an operator is routinely excelling at their particular role, why not give a bonus related to those numbers? It’s another motivating factor to produce quality products, consistently.
We’ve personally seen many of our own customers using the data gathered and contextualized from Mingo to reward employees based on floor numbers.
When performance numbers are turned into dollars, it’s much more impactful for the company and for its employees.
“How do I Calculate the Financial Impact of OEE?”
There are 3 components to OEE: availability (downtime), performance, and quality (read more about those metrics here). All 3 can be converted from a number on the floor to a monetary amount. Once each number is converted into a dollar amount, the sum can then be used to convert OEE from a performance metric to a financial KPI.
Sound confusing? It’s not. We’ll explain step by step how to calculate each metric and in turn, calculate financial OEE.
Downtime
Downtime is also known as availability. Essentially, you’re calculating the cost of not running the machines, cells, or lines on the floor, while paying employees for their time and incurring fixed costs from the machines themselves. These are the overhead costs incurred while not running equipment and not producing any product.
To calculate the cost of downtime, follow the formulas listed below. Simply find a piece of paper and a pencil and jot down your numbers as you read through this blog. We’ve compiled real-life examples that will help guide you through, step-by-step.

Example of Calculating Downtime
Assumptions
- Total Downtime = 90 minutes
- Hourly Cost with Labor and Overhead = $80
Cost of Downtime in Hours Formula:
Downtime in Minutes / 60 = Cost of Downtime in Hours
Cost of Downtime in Hours Calculation:
90 / 60 = 1.5
Cost of Downtime Formula:
Downtime in Hours * Hourly Cost = Cost of Downtime
Cost of Downtime Calculation:
1.5 * $80 = $120.00
This is how much money you’ve lost because the machine or line was down and wasn’t producing any product, yet overhead costs were still occurring.
While downtime is never an ideal situation, it does happen, and unfortunately, it is more common than many of us would like to admit. That being said, it’s crucial for the health of your company to know and understand the cost of downtime, when it does happen.
Performance
The Cost of Performance is going to mean the cost of running slow: not making a product as fast as you should which means not producing at the targets set. The financial impact of slow performance can be calculated by figuring out how much longer a machine or line needs to be run to make up the production deficit.

Example of Calculating Performance
Assumptions
- Ideal cycle time = 30 seconds per part or 2 parts per minutes
- Operating time = 390 minutes
- Actual quantity produced = 730
Total Target Quantity Formula:
Operating Time * Ideal Cycle Time in Parts per Minute = Total Target Quantity
Total Target Quantity Calculation:
390 * 2 = 780
Production Deficit Formula:
Total Target Quantity – Actual Quantity Produced = Production Deficit
Production Deficit Calculation:
780-730 = 50
Minutes to Make Up Part Deficit Formula:
Production Deficit / Ideal Cycle Time in Parts per Minute = Minutes to Make Up Part Deficit
Minutes to Make Up Part Deficit Calculation:
25 / 60 = 0.4167
Cost of Performance Formula:
Hours to Make Up Part Deficit * Hourly Cost = Cost of Performance
Cost of Performance Calculation:
0.4167 * $80 = $33.34
For clarity, the target total quantity is based on the standard. For example, if you can produce 60 parts an hour and you’ve been running for 1 hour, you should have produced 60 parts. In reality, you’ve only produced 41 which means you’re 19 parts short of your target.
Once, you’ve calculated the production deficit, it will be applied to the next formula of determining quality.
Quality
This is the cost of the scrapped product coming off a particular machine or line.

Example of Calculating Quality
Assumptions
- Part Cost = $121
- Total Scrap = 980
Cost of Quality Formula:
Total Scrap * Part Cost = Cost of Quality
Cost of Quality Calculation:
9 x $121 = $1,089.00
The Cost of OEE
When you add all three of these numbers (downtime, performance, and quality) together, you get the cost of OEE.
OEE Can Have a Profound Financial Impact
When you have the cost of OEE figured out, it makes it pretty easy to identify the financial impact of running faster, reducing downtime, and reducing scrap.
To calculate different results, you plug different numbers into the formula, and presto, you know how much money each part costs in total. Then, you can calculate how much more money you can make by improving those things.
Like we said before, OEE is important to manufacturing, but only if there’s context. The same applies to the cost of OEE. If you know why the cost of something is too high or too low, it will be that much more valuable and insightful to you.
