
- Microsoft Excel is a lot to manage for a manufacturer, requiring constant work and updates.
- Transforming data to a manufacturing dashboard in Excel is very difficult.
- Wouldn’t it be easier for data to automatically be gathered and summarized?
Microsoft Excel – it’s a beast of a product. Helpful in some regards, yes, but confusing and easy to screw up, definitely. In the world of manufacturing, Excel is used to record data, but converting that data to something that can be understood is another story. It is often prone to human error in the recording process, not available in real-time, and requires extensive work and time to create any sort of reporting dashboard.
So, why do manufacturers still use the traditional method of pen and paper to record data from the factory floor? It’s a question that continues to perplex us. Stick with us as we explore the possible reasons for the worn-out reliance on traditional reporting methods, and what solutions, (ahem Mingo!) can help do to transform the industry.
What Data Do Manufacturers Typically Keep in Spreadsheets?
Not to sound redundant, but, manufacturers keep literally everything in spreadsheets. Those spreadsheets can include everything from job work orders (if you want to get technical, job work and production order also mean the same thing), downtime, OEE, maintenance schedules, and quality data. You name it, and it’s probably included in a spreadsheet.
It goes without saying that there is a lot of data included in a spreadsheet.
How Do You Turn Manufacturing Data in Excel into a Dashboard?
It is possible to build a dashboard in Excel, but it is extremely complicated, can become outdated quickly, and is difficult to share with multiple people in a company.
In this scenario, there are people on the line that input quality, downtime, and production data into an Excel sheet. If your company has several locations, maybe each location has its own tab. Someone must then summarize all of the inputted information together and then somehow format that data into a dashboard. The question we ask is, “How can you guarantee that data is 100% accurate?” And, if that data is correct, it still raises the issue that hard-working employees are wasting time by hand-inputting data when it could be summarized for them, instantly, leaving them to concentrate on other tasks.
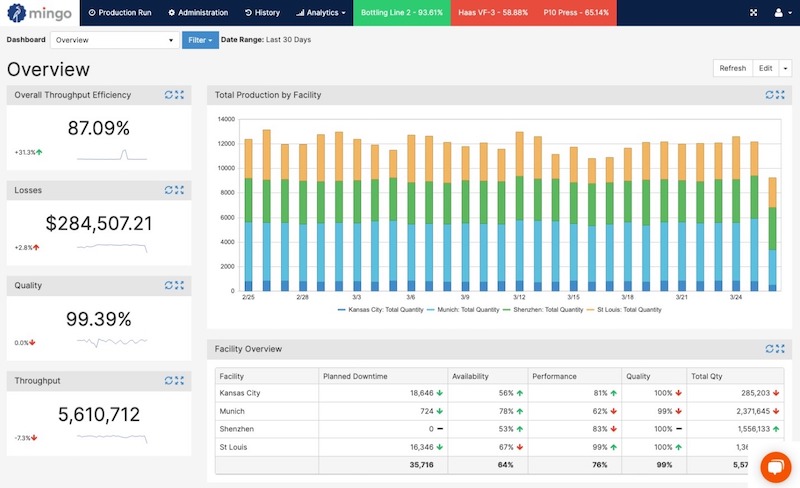
The more efficient and frankly, easier option, is to use a tool that can make the data collected user-friendly. Software tools such as Power BI, Tableau, or (shameless plug here!) Mingo will help you make sense of the data by putting it into a dashboard.
What Dashboards Do Manufacturers Need?
In a high-level overview, there are two essential dashboards that manufacturers need. One entails tracking numbers against the daily, weekly, monthly, quarterly, or even yearly plan. This dashboard is designed to be looked at on a daily basis. Did we hit the numbers yesterday? Are we on track for the week? Will we need to run overtime if we aren’t projected to hit the numbers?
The other is the current status dashboard that analyzes how a factory floor is operating at that current moment. What is up? What is down? Which machines or work cells are running behind? Why is a particular machine not running? Are scrap rates increasing on a particular machine?
Primarily, that dashboard will evaluate quality issues, based on data acquired, determine what those issues are, and where they are coming from. Knowing this data can find and fix problems that are currently happening.
The two dashboards work hand-in-hand with one another, but the key factor of success is if those dashboards are actively being kept up-to-date accurately.
How Do Manufacturers Collect Data in Dashboards Without Using Excel?
With the use of Mingo, of course! You guessed it, we did toot our own horn there, but there are amazing benefits to being able to monitor, analyze, and understand your data.
But, we diverge. There must be some sort of automated system in place, whether that be a product like ours, an MES system, or an ERP system to collect the data and convert it into a format that is easily viewed and understood. While data is great, it serves very little purpose if you cannot understand and make actionable decisions based on what the data tells you.
It’s alarming to think that with all the tools and technology out there that some people are still using pen and paper to record the data. The process is lengthy and cumbersome because if you think about it, the data needs to be recorded by someone, by hand, given to a front office, and then transcribed into another system for usability. Even if it’s done quickly, the process does not hold a candle to data that can be gathered almost instantly and used in real-time.
If you’re still using the long, outdated, mundane process of gathering data by hand, you may want to consider embracing an automated system that can make that process more efficient for you and your company.
